TL; DR 
Key Takeaways on Increasing AOV

- AOV is the fastest revenue lever most ecommerce teams underuse — it requires no extra traffic, just smarter use of existing customers.
- AI-powered recommendations are the highest-impact tactic, with typical AOV lifts of 15 to 30% — eXtra saw 52% using Algonomy Recommend™.
- Product bundling drives 20 to 30% AOV uplift; customers who buy bundles have significantly higher lifetime value.
- Free shipping thresholds set 15 to 25% above current AOV consistently push customers to add one more item.
- Social proof and urgency signals reduce hesitation on higher-priced items — but only when they reflect real data.
- RPV (Revenue Per Visitor) is the metric that tells you whether AOV gains are actually working.
Most ecommerce teams aren’t fully leveraging the biggest growth lever they actually own.
They’re running A/B tests on button colours. Reworking PDP layouts. Rebuilding checkout flows for the third time in two years.
All of that has value, but none of it directly answers a more important question: how to improve Average Order Value (AOV).
Even a 10% lift in AOV can drive significant incremental revenue without any additional traffic. It simply means the customers already on your site spend more per transaction.
The idea is straightforward. The mechanics aren’t complicated. What’s hard is prioritization.
In this blog, we discuss how to systematically improve average order value through merchandising, pricing, bundling, and on-site experience.
Want to know where your AOV and RPV are underperforming? Our RPV Teardown maps the gaps across your funnel and gives you a 90-day plan to fix them.
What is Average Order Value (AOV)?
AOV Definition
Average Order Value (AOV) is the average amount a customer spends per transaction on your site over a given time period. The reason it matters so much is that it sits at the intersection of two things every ecommerce business cares about: revenue and profitability.
Raising your conversion rate gets more people buying. Raising your AOV gets the people who are already buying to spend more. The second option is almost always cheaper and faster.
AOV Formula
The calculation is straightforward:
AOV = Total Revenue ÷ Number of Orders
Say your store did $500,000 in revenue last month from 5,000 orders. Your AOV is $100. If you increase that to $110 without changing your order volume or ad spend, you’ll be getting an extra $50,000.
But please make sure you’re excluding returns and refunds from your revenue. What matters is the AOV customers actually keep, not what they initially bought.
Gross AOV can look strong on paper, while returns quietly eat into your margins.
Where AOV is Used
AOV is most commonly talked about in ecommerce, but the concept applies across business models.
In ecommerce, it’s the metric with which bundling, cross-sell, and checkout strategies are measured.
In SaaS, the equivalent would be average revenue per user (ARPU). Whereas in marketplaces, AOV helps sellers assess whether their catalogue and pricing are working and gauge platform health.
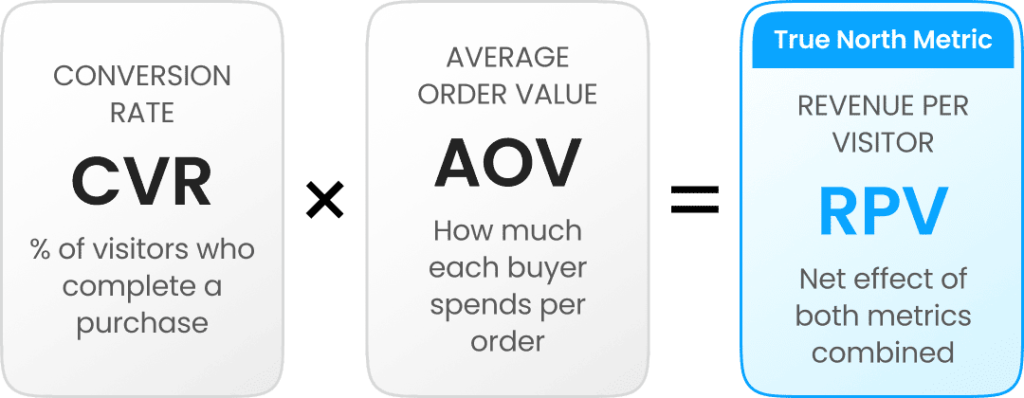
AOV vs Conversion Rate vs Revenue Per Visitor
These three metrics are related but distinct. Let’s understand the difference.
Conversion rate (CVR) measures the percentage of visitors who complete a purchase. AOV measures how much those buyers spend. And Revenue per visitor (RPV) is the product of both: CVR × AOV, giving you a clear view of your store’s overall performance.
That distinction matters in practice.
For instance, you can increase conversion by lowering prices or simplifying checkout, but that might lower AOV. You can boost AOV by encouraging larger baskets, but that can hurt conversion rates.
So, it’s the RPV that tells you whether those trade-offs are actually working.
Instead of optimizing these metrics in isolation, consider them together. That’s how you know if you’re truly improving performance.
Why Average Order Value is a Critical Ecommerce Metric
AOV as a Revenue Growth Lever
Most growth conversations in ecommerce start with traffic. How do we get more visitors? How do we lower CPC? How do we improve paid ROAS? Those are real questions. But they’re also expensive questions to answer.
AOV is different. You’re working with buyers who’ve already pulled out their payment details. Getting them to spend 15% more is fundamentally different from convincing a cold audience to buy at all.
For a retailer with $50M in annual revenue, a 10% increase in AOV adds $5M to the top line. No new campaigns. No landing page rebuilds. No SEO overhaul.
Impact on Profitability
Revenue is one thing. Profitability is another. The reason AOV improvements are so profitable is that most of your order-level costs are fixed.
Fulfilment, packaging, customer service, and payment processing costs don’t double just because a customer adds a second item to their cart. So when AOV increases, the incremental revenue from that additional spend largely falls through to margin.
It’s not unusual to see gross margin per order improve by 5–8% just from an AOV initiative that didn’t involve discounting.
CAC payback improves as well. If your CAC is $40 and your average order is $100 with a 40% margin, you make $40 per order. That just covers your acquisition cost, so you break even.
Increase AOV to $120, and you now make $48 per order. After covering CAC, you’re left with $8 profit on the first purchase. That means every repeat purchase is profit from the start.
AOV and Customer Lifetime Value
High AOV and high LTV often go hand in hand, but not just by chance.
Customers who spend more on a single order are more invested. They are exploring more of your catalog, trusting your brand and buying with intent. That kind of behavior usually doesn’t end with one purchase.
In other words, higher AOV is often a signal, not just a result.
It tells you that these customers are more engaged, more likely to come back, and more valuable over time.
So AOV is not only about what we spend today. It’s a good indication of what they might be worth tomorrow.
Why Increasing AOV is More Efficient Than Traffic Growth
A 20% boost in organic traffic may take months of consistent content and SEO investment.
On the other hand, a 20% lift in AOV through a well-calibrated free shipping threshold or a strong cross-sell program can go live in as few as weeks.
That makes a difference.
Acquisition can often be a treadmill. You pay more to get new visitors, and CAC rises as competition increases.
AOV optimization is another story.
It taps into the demand you already have. And as you learn what your customers respond to, it’s easier and more efficient to maintain over time.
What is a Good Average Order Value?
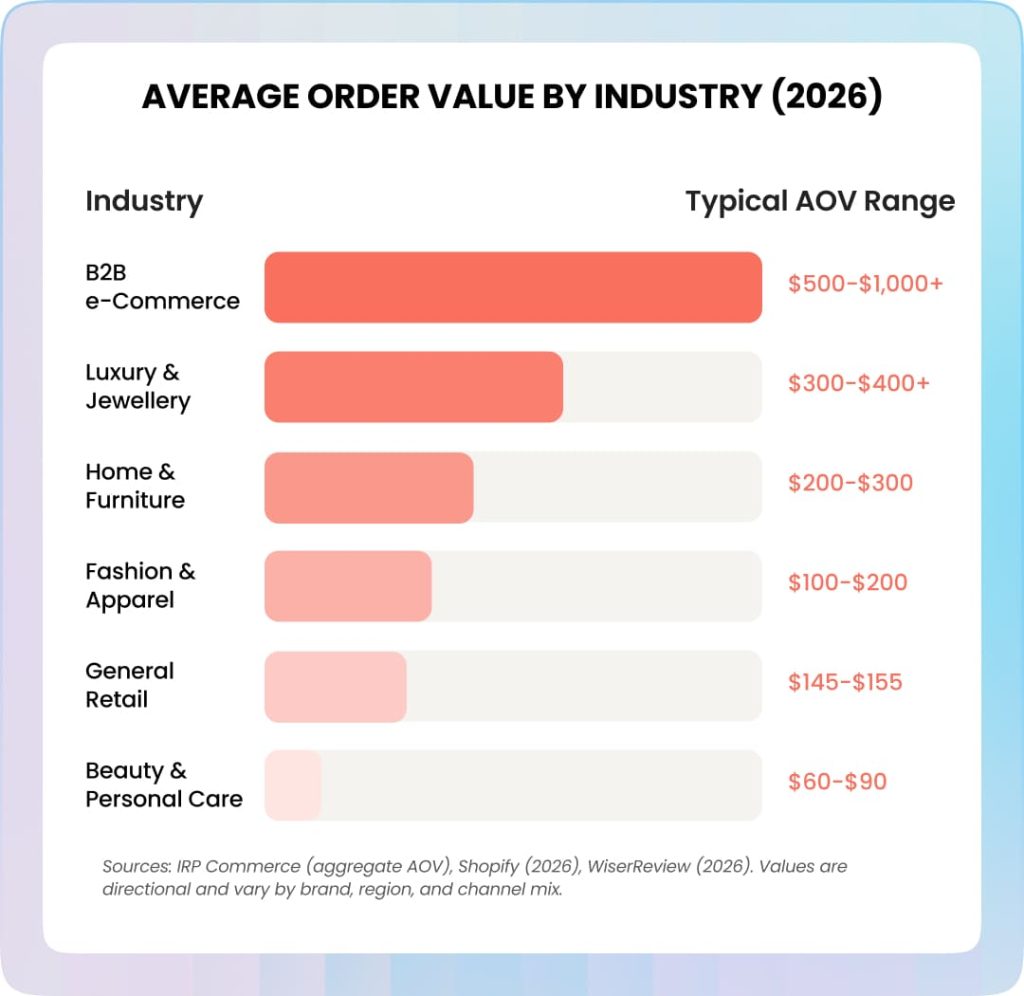
According to Shopify, the global average for all industries is $145 in 2026.
But benchmarking against the global average is meaningless. Here’s the AOV you should be aiming for in your industry:
AOV Benchmarks by Industry
Factors That Influence AOV
There are several factors that determine where your AOV lies, and understanding them will tell you which levers are worth pulling.
- Product pricing: A store selling $20 accessories will have a structurally lower AOV than a store selling $200 footwear, no matter how strong its cross-sell strategy is.
- Customer segment: Returning customers tend to spend more than first-time buyers. High-intent shoppers (such as branded search) also tend to have a higher AOV than broad awareness channels.
- Geography: Purchasing power, shipping expectations, and spending behaviour vary widely by market, which determines how much customers are willing to spend per order.
- Brand positioning: A brand positioning that suggests quality and premium value tends to attract customers who are willing to spend more per transaction.
How to Calculate Your Ideal AOV
Working backwards from your unit economics gives you a more realistic AOV target.
Begin with your CAC. If you acquire a customer for $60 and have a 45% gross margin, you need $133 in revenue just to break even on the first order. So the AOV has to be higher than $133 before you’re even profitable on acquisition, and that’s before fixed costs.
Run this calculation with your own numbers, and you will know where you are at very quickly. It shows whether your current AOV is healthy, marginal, or fundamentally misaligned with your business model.
How to Calculate and Track Average Order Value
Manual Calculation
Pull your total revenue for any period, divide by total completed orders in that same period, and you get AOV. The period matters as AOV changes with the seasons, so compare apples to apples (this November vs last November, not this November vs August).
Please note that you should always exclude cancelled and refunded orders from both numbers.
Tracking AOV in GA4
In GA4, you can measure the AOV in the Monetisation → Ecommerce Purchases report. The metric is called “Average Purchase Revenue.”
It’s really useful when you can segment it by traffic source, device type, geographic region and user type. For example, a 15% difference in AOV between mobile and desktop tells you there’s a checkout or product display problem.
Tracking in Shopify
Shopify’s Analytics dashboard places AOV front and centre in the Overview section.
A more useful view lies in “Sales by product” and “Sales by discount,” where you can cross-reference AOV with which products or promotions are in the mix.
So, you can see if a campaign that “improved” AOV actually did so because of higher-value items or just heavier discounting.
Using CDPs and Analytics Tools
Segment-level AOV tracking is where the real insights live. A customer data platform (CDP) lets you analyse AOV by cohort: loyalty members vs non-members, first-order vs fifth-order shoppers, and shoppers who engaged with recommendations vs those who didn’t. Without this segmentation, AOV is an average that masks the interesting details.
The 3 Core Levers to Increase Average Order Value
Before diving into tactics, let’s understand the three fundamental ways AOV moves.

Increase Items
Per Order
Encourage shoppers to add more items to their cart.

Increase Price
Per Item
Drive value perception and upsell higher-priced options.

Reduce Friction to Spend More
Remove barriers and make it easy to spend more.
Increase Items Per Order
Get customers to add more to their cart. Cross-sells, bundles, and “frequently bought together” recommendations all help.
Reducing friction also plays a big role through one-click add-ons, visible related products, and simple bundle builders.
The key metric here is items per order (IPO), not just AOV.
If the IPO is rising but AOV isn’t, it usually means customers are adding more low-value items. That’s a sign to improve what you’re recommending.
Increase Price per Item
Get customers to buy a more expensive version of what they’re already thinking about. Upsell with premium variants or improved versions with better features or materials.
Here, showing higher-priced options first, clearly communicating the value of premium tiers, and using guided selling tools all help.
Reduce Friction to Spend More
Sometimes the issue isn’t a lack of willingness to spend. It’s friction.
A complicated checkout. An unclear free shipping threshold. A payment method that feels risky for larger purchases.
Frictions like these can suppress AOV even when intent is high. Remove such frictions and watch AOV increase.
How to Increase Average Order Value: Proven Strategies
Personalization and AI-Driven Strategies
AI-Powered Product Recommendations
At a basic level, recommendations work by showing customers what they’re likely to buy next. But the real impact comes from relevance and timing.
AI recommenders such as Recommend™ use browsing behavior, past purchases, and real-time signals to recommend the right product at the right moment.
Manual rules don’t scale. You can’t hand-pick cross-sells for thousands of products. AI systems can. They learn continuously from what customers actually click and buy and improve over time without manual effort. And that’s how AI-driven recommendations increase average order value in the long term.
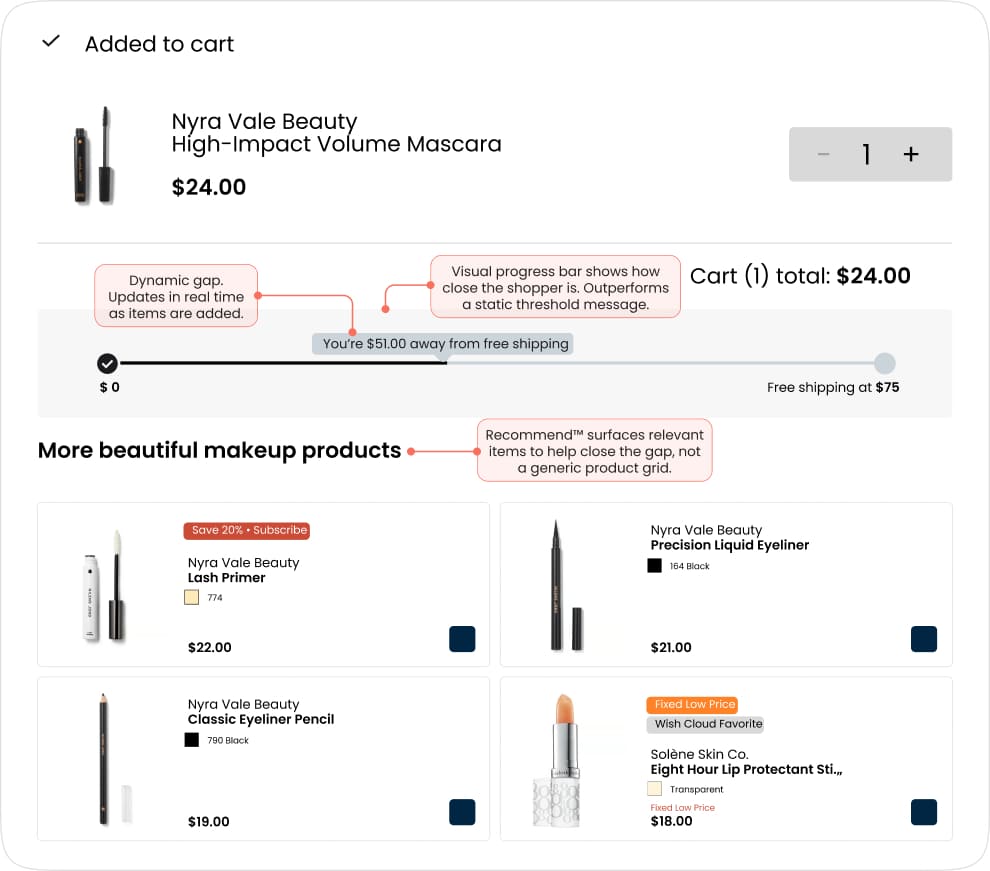
Placement matters just as much as the algorithm. Recommendations shown in the cart or at checkout tend to drive more AOV than those on product pages, simply because intent is higher at that stage.
For example, retailers using Recommend™ have seen measurable increases in items per order shortly after implementation. eXtra, Saudi Arabia’s largest electronics retailer, achieved a 52% higher AOV from AI-powered recommendations.
In some cases, AI-driven recommendations have driven significant AOV gains alongside improvements in engagement and conversion. A Brazilian beauty retailer that deployed Recommend™ alongside Find™ saw a 55% increase in AOV, a 4% conversion lift, and 3x session engagement.
See how Recommend™ can drive AOV growth for your ecommerce funnel, from PDP to checkout.
Personalized Search
Search is where high-intent shoppers show up.
If someone is typing in your search bar, they already know what they want. Search’s role is not just to match keywords but to find the best product for that particular shopper.
Personalised search re-orders results based on behaviour. The customer who likes premium brands sees premium products first. Find™ does exactly this. It interprets intent, not just keywords, and personalises results from the very first interaction.
Better outcomes lead to more confident decisions and often higher-value purchases.
Search features that personalise results also create natural cross-sell and upsell opportunities.
When a shopper searching for a camera sees compatible accessories ranked alongside it, or a premium model surfaced above the standard version, the search experience itself becomes an AOV driver.
Explore how personalized search powered by Find™ can improve your search experience and drive higher-value purchases.
Real-Time Personalization
Static experiences treat every visitor the same.
Real-time ecommerce personalization adjusts what each shopper sees, based on what they’re doing right now. That could be product recommendations, banners, or category rankings.
The more relevant the experience, the easier it is for customers to find what they want, and the more likely they are to spend more in a single session.
Behavioral Targeting
Your customers tell you what they want with their actions.
Multiple product views, category exploration, and previous purchases are very good indicators. Behavioral targeting then leverages these signals to send timely nudges, reminders, relevant offers or possible follow-up recommendations.
You no longer hope that customers stumble across products; you meet them when they are expressing intent.
That’s what drives higher AOV.
See exactly where your AOV is leaving money on the table
If you raise AOV but fewer people convert, your revenue stays flat. RPV catches that. An RPV Lift Teardown with Algonomy pinpoints which pages, segments, and touchpoints are dragging down the RPV Lift. The best part? The analysis is absolutely free.
You’ll get:
- Where AOV and RPV are leaking, by page and segment
- Gaps in recommendations, search, and personalization
- A focused 90-day plan to lift AOV, CVR, and RPV
Cross-Selling and Upselling Strategies
Cross-selling and upselling are two of the most effective ways to increase AOV.
According to McKinsey, Amazon had even reported that up to 35% of its revenue was driven by cross-sell and recommendation systems.
Upselling moves customers to a higher-value version of what they’re already considering. Cross-selling adds complementary items to the basket.
Both depend on relevance. If the suggestions don’t fit, they get ignored, or worse, reduce trust.
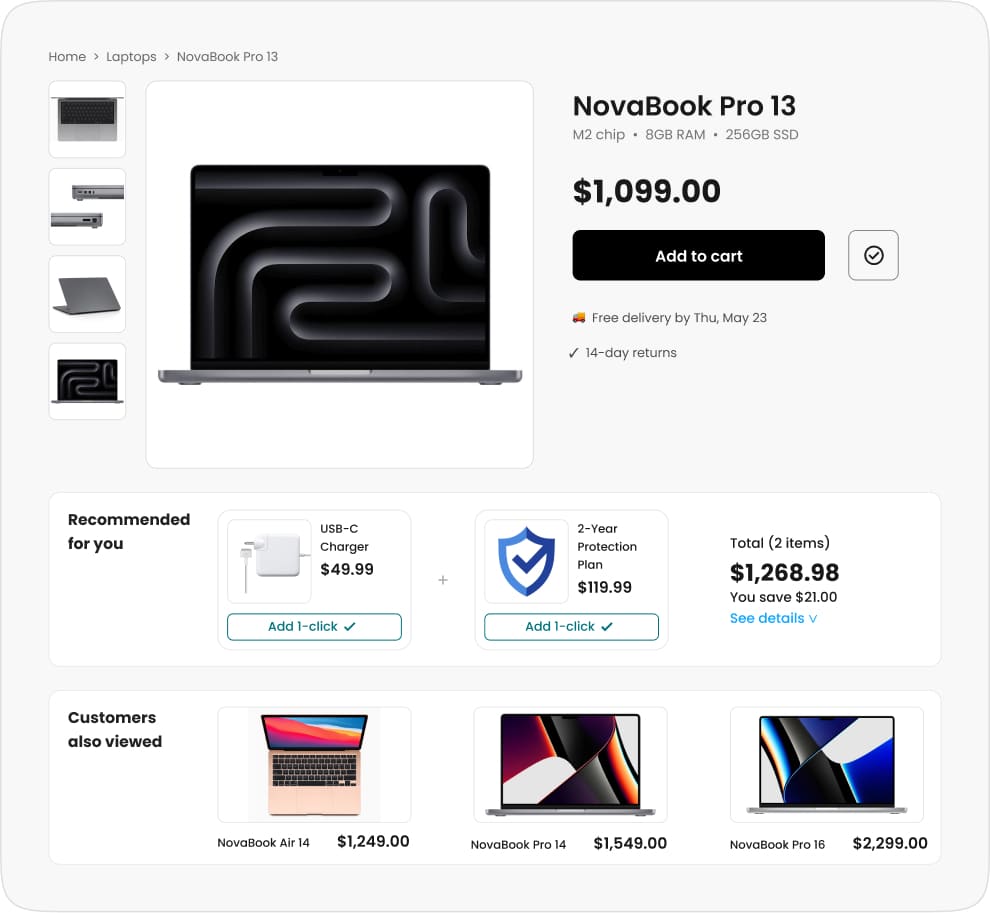
Product Page Cross-Selling
“Frequently bought together” is one of the most familiar cross-sell formats and still one of the most effective when it’s based on real purchase data rather than manual curation.
On high-consideration product pages, it removes the need for customers to figure out what else they might need, and makes it easier to buy the complete set.
But remember: the key is specificity.
“Customers who bought this camera also bought this memory card and case” works. But “You might also like these cameras” is just confusing.
Cart-Level Cross-Selling
The cart is a high-intent moment for shoppers. They have already decided to buy, but they just haven’t checked out yet.
When you show one or two relevant, low-priced add-ons that are easy to add, customers are more likely to include them without feeling forced.
Less matters here. Too many suggestions create friction, as we’ve already seen above.
The suggestion that closes the threshold gap
Matas, Denmark’s largest health and beauty retailer, used Recommend™ to personalise cart-level cross-sells, resulting in a 38% increase in items sold via recommendations. We can do the same for your store.
Post-Purchase Upselling
Post-purchase upselling is probably one of the most underestimated AOV tools available to retailers.
As soon as customers complete their purchase, once they reach the confirmation screen or receive their order confirmation email, the payment method is known, and they will be less resistant to further offers.
This stage is especially beneficial for subscriptions.
AI-driven post-purchase solutions take this further. Instead of showing a generic upsell on the confirmation page, platforms like Recommend™ use purchase signals and behavioural data to surface the most relevant add-on for that specific customer at that specific moment.
That relevance is what makes post-purchase one of the highest-converting placements for AOV growth.
Product Bundling Strategies
Bundles are one of the most effective ways to increase AOV. They typically drive a 20–30% lift, and customers who buy bundles tend to have much higher lifetime value than those who buy single items.
The reason is both practical and psychological. Bundles remove the need to make multiple small decisions and make it easier for customers to commit to a higher total spend.
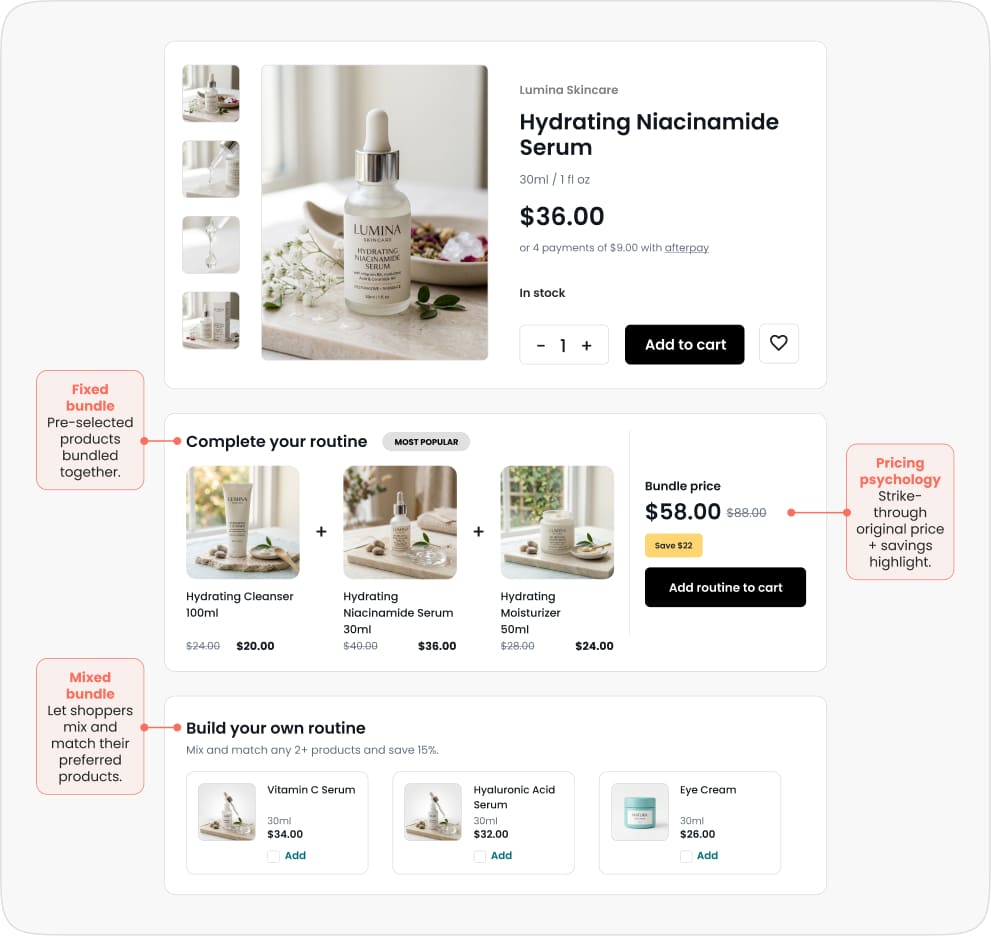
Fixed Bundles
Pre-made bundles work best when the “right combination” is already obvious.
Imagine a skincare starter pack, a basic camera with a lens, or a coffee maker packaged with filters and coffee beans. It’s obvious that you get all you need without extra effort.
You’ll be surprised, but naming plays a crucial role here. As you can tell, “Complete skincare starter kit” obviously sounds much better than “3-item bundle”.
Mix-and-Match Bundles
Mix-and-match bundles offer customers some structure yet still allow them choices.
This approach works very effectively for products/services where customer preference is high; for instance, “Select any 3 flavours to enjoy a 20% discount” or “Create your own skin care regime”.
Herein lies the paradox.
Choice adds more friction to the process, resulting in lower conversion rates than with fixed bundles. However, once converted, the customer spends even more because they have crafted their own bundle.
AI-Based Bundles
This is where scale becomes a real advantage.
AI-driven bundles use actual purchase data to generate combinations that are more likely to convert. Instead of relying on manual curation, the system continuously learns which products work well together and updates in real time.
That’s why these bundles tend to outperform manually created ones. They’re always based on what customers are actually doing, not what we think they might do.
Platforms like Recommend™ go a step further by factoring in margin, so you’re not just increasing AOV but doing it profitably.
For retailers looking for dynamic bundling tools to increase average order value, Recommend™ is built specifically for this. It generates bundles from real co-purchase data, applies compatibility and margin rules, and updates automatically as buying behaviour changes without any manual curation.
Pricing Psychology in Bundle Presentation
How you present a bundle can make a big difference.
“Save $18” works better than “Bundle price $82” because the benefit is immediate. Customers shouldn’t have to do the math.
Customers find it much easier to see the value when the original prices are shown next to the bundle. It gives them something concrete to compare against and makes the savings feel more real.
Even small nudges can make a difference. A simple prompt like “Buy one more to unlock bundle pricing” is often enough to push them to complete the bundle.
Lift AOV with bundles that actually convert
Recommend™ combines shopper signals, compatibility rules, and margin logic to build winning bundles for your catalog.
Pricing and Discount Strategies
Pricing and discounts can boost AOV quickly, but only if they’re structured correctly.
Volume Discounts
“Buy more, save more” works because it gives customers a clear reason to add one more item.
Tiered offers like “10% off 3 items, 15% off 5” create a simple progression. Once a customer is close to the next tier, they’re likely to push a bit further to unlock it.
That said, it’s easy to get this wrong. If your thresholds are too low or your discounts too aggressive, you’re just giving away margin on purchases that would have happened anyway. The goal is to ensure that the extra items more than offset the discount.
Tiered Pricing
While volume discounts push shoppers to buy more, tiered pricing encourages them to spend more on a single item.
A “good, better, best” setup makes comparison easy. When the price increase is small relative to the added value, the customer will naturally move up a tier.
This is where anchoring comes in. Showing a higher-priced option first makes the next option feel more reasonable, even if that’s where you wanted customers to land all along.
Limited-Time Offers
Another driver that works well is urgency.
When customers see a deadline, like “Only available until Sunday”, they’re more likely to act now instead of putting the decision off. And when they do act, they often complete a larger basket in the same session.
But this will only work if it’s genuine. If every offer is for “limited time,” customers stop believing it.
Coupon-Based Incentives on Spend Thresholds
Spend-based offers like “Spend $150 and get $20 off” combine urgency with a clear target.
It works best when the required spend is just a little higher than what the customer was already going to spend. It should feel easy to reach, but still require the customer to add something extra.
This is where segmentation helps. Loyal customers can stretch further, while new customers may need a lower threshold to engage. A single blanket offer rarely works as well as a tailored one.
Cart and Checkout Optimization
The cart and checkout are high-intent moments. A small change here can really help increase order value.
Free Shipping Threshold
Research indicates that free shipping increases average order value in any business. In some cases, more than 50% of consumers have admitted to adding items to their shopping cart to take advantage of free shipping. In fact, free shipping can increase AOV by 15-30%.
Free shipping is one of the most reliable ways to increase AOV, because it directly changes how customers behave. In fact, 58% of shoppers add items to their cart specifically to qualify for free shipping (Deloitte), while 39% abandon checkout due to unexpected shipping costs (Statista).
That’s the balance you need to get right.
Some customers add more items to reach it. Others leave when they see shipping costs. So the goal is to set the right minimum spend.
That minimum should be slightly higher than what customers usually spend, just enough to nudge them to add one more item.
If it’s too low, you lose margin. If it’s too high, customers won’t try to reach it. And the threshold should be updated over time as prices and behaviours change.
Cart Progress Indicators
A simple message like “You’re $12 away from free shipping” is more effective than just stating the threshold. It turns a passive condition into an actionable state.
Progress bars go one better, showing the shopper how close they are, especially on mobile.
But the real kicker is combining that with suggestions.
Just showing the gap isn’t nearly as effective as saying “Add this screen protector ($8) to unlock free shipping”.
Set your free shipping threshold and let Recommend™ surface the right product to close the gap.
Cart Progress Indicators
What stops the customer from making additional purchases is friction.
A one-click add-on solves this problem by allowing users to add something valuable yet affordable to their cart with a single click.
This works best for things like accessories, warranties, consumables, or gift options, especially when they’re simple and don’t require extra decisions.
Reduce Checkout Friction
Sometimes, it isn’t weak cross-sell hindering AOV; it’s the checkout process itself.
Forms that seem too lengthy, surprise fees, or even vague policies may make consumers pause, especially when making large purchases.
A streamlined and straightforward checkout process that signals returns, security, and product reviews removes such hesitation.
Payment and Financing Strategies
Making higher-priced items feel easier to buy is one of the most effective ways to increase AOV. Let’s see a few strategies.
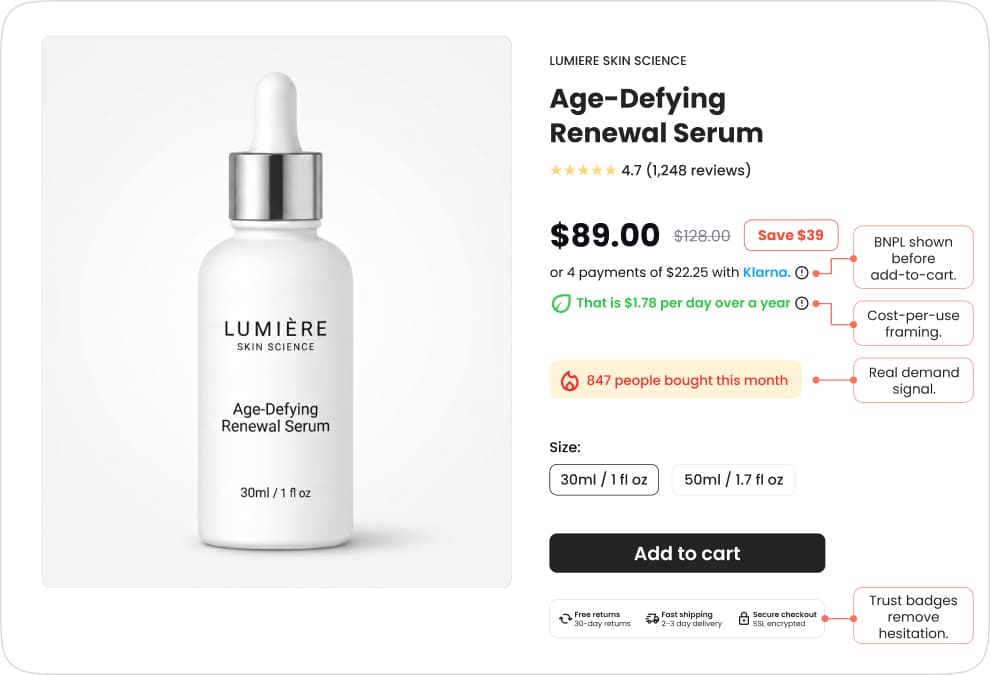
Buy Now, Pay Later (BNPL)
BNPL can increase AOV by making higher-priced items feel more affordable, especially across categories like beauty and fashion.
For example, instead of looking at an expensive item, a $480 sofa, the customer could look at a more palatable version, “of four payments of $120.”
That’s how BNPL consistently lifts AOV across categories.
Show Installments Early
Many retailers only show BNPL at checkout. This is too late.
To influence AOV, installment pricing needs to appear on the product page, before the add-to-cart decision, when customers are still deciding what they can afford.
Reduce Price Sensitivity
BNPL is one way to do this, but more importantly, it comes down to how you present the price.
Instead of focusing only on the total cost, break it down. Show cost per use, highlight long-term value, or make it clear what customers might spend over time if they choose a lower-quality option. These small shifts make higher-priced items easier to justify.
Social proof, such as demand signals, helps too. When customers see that others have bought and liked a higher-priced item, they’re more comfortable choosing it themselves.
The goal isn’t to make things cheaper. It’s to make the value clearer, so customers feel confident spending more.
Stop losing AOV at the decision moment
When shoppers hesitate on a higher-priced item, the right social proof signal closes the gap. Start with 1 to 2 trust and urgency widgets on your highest-value PDPs and see the difference in 30 days for free.
Loyalty and Retention Strategies
The customers you already have are often your biggest AOV opportunity. Let’s see how to capitalize them.
Loyalty Programs
Loyalty programs don’t just bring customers back; they also increase how much they spend.
Loyalty program members tend to spend more because rewards are tied to their purchases. It turns every buy into a quick decision, so adding one more item feels like the obvious choice.
That thinking consistently pushes order values higher.
Tiered Rewards
How you structure your loyalty program matters.
Tiered systems, like bronze, silver, and gold, give customers something to work toward. As they get closer to the next tier, they’re more likely to increase their spend to unlock it.
In practice, this works a lot like a personalized free shipping threshold. The closer customers are to the next level, the more likely they are to stretch their basket.
Subscription Models
Subscriptions build on an existing relationship.
Once a customer commits to a recurring purchase, the decision is already made. That makes it easier for them to add more items over time, especially complementary products.
You’re not just increasing repeat purchases, you’re increasing the value of each one.
VIP Customers
Your highest-spending customers should feel it.
The top 5–10% of your customer base often drives a disproportionate share of revenue. Giving them early access, better recommendations, or a more personalized experience signals that they’re valued.
And when customers feel valued, they tend to spend more.
Merchandising and UX Optimisation
AOV isn’t just about pricing; it’s about what you show and how you present it.
Product Placement
What you promote is what gets bought.
If your homepage, category pages, add-to-cart pages and emails mostly feature mid-range or lower-margin products, that’s what customers will gravitate toward.
On the other hand, consistently showcasing higher-value items helps customers get familiar with them and makes those price points feel normal.
For fashion ecommerce specifically, AOV lift often comes from outfit-based recommendations rather than individual product cross-sells.
Showing a complete look alongside a single item is consistently more effective than recommending another jacket. Recommend™ builds “complete the look” bundles using merchandising rules, making it one of the most direct tools for increasing AOV on fashion ecommerce websites.
High-Margin Products
Not all AOV gains are equal.
A $50 increase driven by a high-margin product is far more valuable than the same increase coming from a heavily discounted item. That’s why it’s important to be intentional about what you push.
Focus on products that have the right mix of margin, conversion potential, and cross-sell value, and make sure they show up in recommendations, bundles, and key placements across the site.
Anchor Pricing
The first price the customer sees influences all subsequent decisions.
When presenting the customer with a $500 item, anything priced at $200 will seem quite reasonable. On the other hand, when presenting the customer with a $200 item, anything above will seem quite costly.
That is precisely why starting with the high-end items works well; it creates a reference point, making everything else seem affordable.
Visual Merchandising
How a product looks affects how much customers are willing to pay for it.
Good images, descriptions, and context all create confidence, even more so when dealing with high-end products. Premium-looking products are more expensive for a reason.
The best recommendations will not work if the page on which they appear is not done well enough. It is as important as placement.
Psychological Triggers
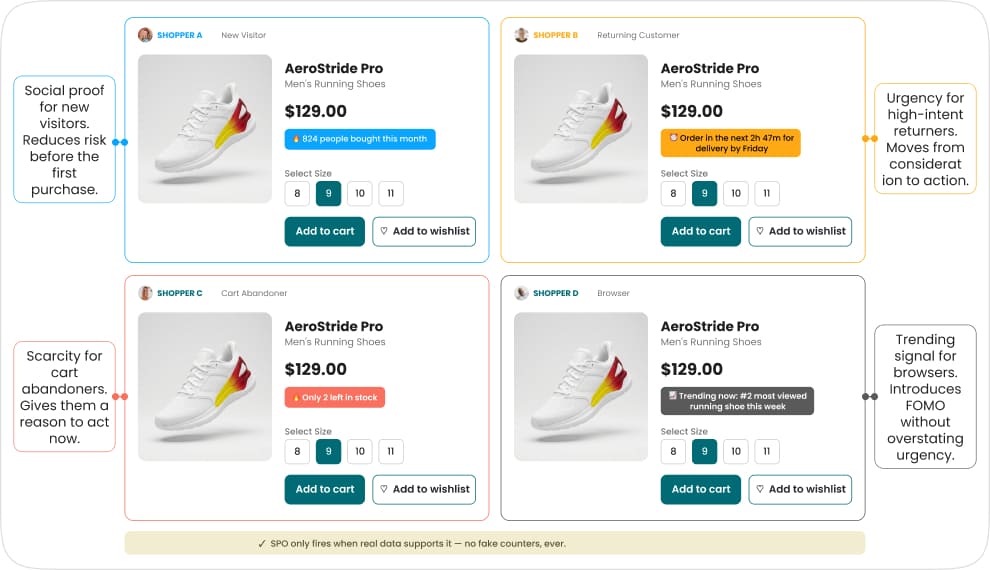
Scarcity
Or saying something like “Only 3 left in stock” works because it gives the customer a reason to act now.
People don’t want to miss out when something seems limited. This is especially true for higher-value items that people tend to buy more tentatively.
But it only works if it’s genuine. Trust disappears quickly if customers think it is manufactured.
Tools like Social Proof Optimize help here because they only show scarcity signals when the data actually supports them, keeping the message credible.
Social Proof
Social proof reduces the hesitation.
Reviews, ratings, or cues like “X people bought this today” make more expensive products feel safer to buy. It seems less risky if other people have bought it and been satisfied. This is especially important for products above a customer’s normal spend, where doubt is at its highest.
The problem is that most retailers send the same message to all shoppers. High-intent returning customers and first-time visitors need different things to feel confident.
Social Proof Optimize knows who’s looking, what they need to see at that moment, and selects the most likely-to-convert message for that visitor.
Urgency
Urgency moves people from thinking to doing.
Deadlines, countdowns or limited-time offers reduce the likelihood that a customer leaves and never comes back. And when they do decide to buy, they’re more likely to buy a larger basket at that moment. It works even better when combined with bundles or tiered offers.
Social Proof Optimize tracks purchase velocity in real time, so signals like “selling fast” or “trending now” are representative of what’s actually going on on your site, not a label someone set last quarter. It’s actually happening on your site, not a static label someone set last quarter.
Perceived Value
Sometimes the issue isn’t price, it’s clarity.
Customers don’t always see why a premium option is worth more. Clear product descriptions, comparisons, and strong visuals help bridge that gap. When a product looks and feels premium, it becomes much easier to justify the price.
Stop losing AOV at the decision moment
When shoppers hesitate on a higher-priced item, the right social proof signal closes the gap. Try SPM Quickstart free — 1 to 2 trust and urgency widgets on your highest-value PDPs, results in 30 days.
A/B Testing Strategies to Improve AOV
What to Test
- Pricing thresholds: Free shipping cutoffs, discount tiers, and bundle pricing. These have some of the largest AOV effects and are fast to test.
- Bundle configurations: Fixed vs mix-and-match, bundle names, discount display format (“save $X” vs. “% off”), number of items per bundle.
- Recommendation placements and formats: PDP widget vs below-the-fold; carousel vs grid; number of products shown; heading copy.
- Checkout add-ons: Which products to surface, at what price points, with what copy.
Experiment Ideas
Run a threshold test: split your audience into three groups — the current free shipping threshold, a threshold set 15% above AOV, and a threshold set 25% above AOV. Monitor AOV, conversion rate, and RPV across all three for four weeks. The RPV winner, not the AOV winner alone, is the threshold to roll out.
Test upsell message framing: “Get the full-size version” vs. “Most shoppers who bought this went for the full-size” vs. “The full-size is $20 more and lasts twice as long”. These differences in framing often lead to 15-30% differences in conversion rates on the same underlying upsell.
Measuring Impact
As we’ve discussed before, AOV alone is a misleading success metric for most AOV experiments. The correct framework is:

AOV

Conversion
rate

Revenue
per visitor

Gross margin
per order
Measure all four of them. A 12% lift in AOV but an 8% drop in conversion and a 5% drop in margin are not a win.
Scaling Winning Experiments
When an experiment wins clearly on RPV and margin, roll it out in stages rather than all at once — segment by segment (loyalty members first, then returning customers, then new visitors), or channel by channel. This gives you a safety net if there’s an interaction effect you didn’t catch in the test, and it gives you additional data on whether the lift holds across different customer types.
Common Mistakes That Hurt Average Order Value
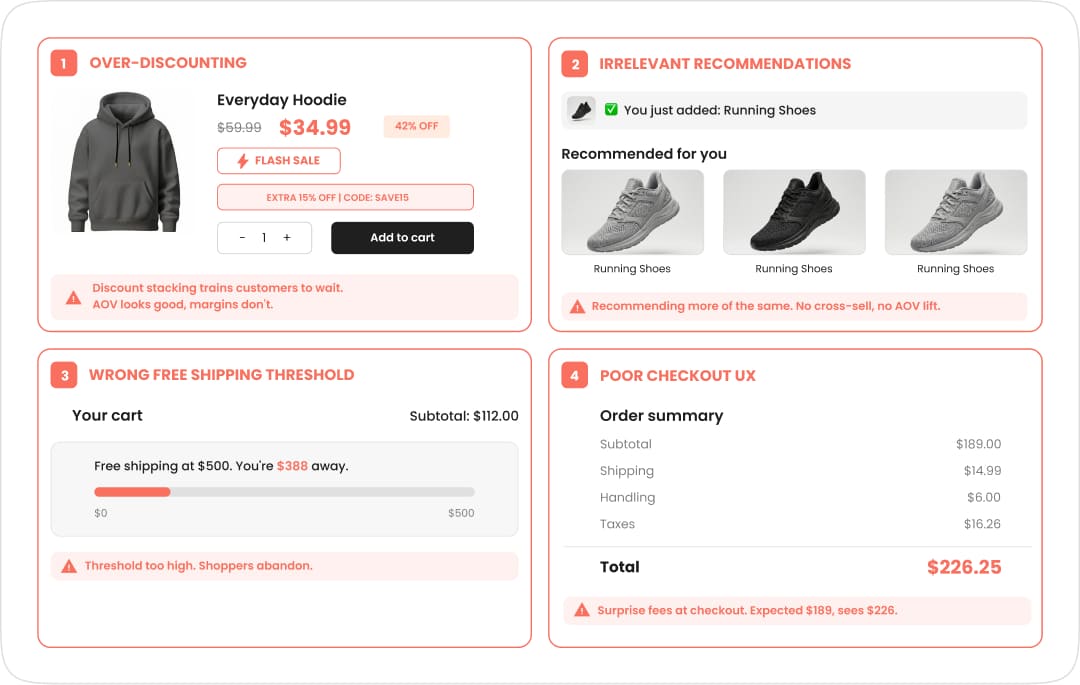
Over-Discounting
Discounts may temporarily increase AOV, but they are highly susceptible to overuse.
If consumers begin to expect a 20% discount, they will wait for it, or they may start perceiving the new reduced price as a price increase. This will eventually reduce your AOV and increase your growth costs.
Please be smart about how you implement discounts, and make sure they have an expiration date.
Irrelevant Recommendations
A “you might also like” widget showing completely unrelated products doesn’t just fail to convert, it actively undermines trust in your product curation.
Shoppers who see irrelevant suggestions conclude that your brand doesn’t understand their needs, and that contaminates the whole shopping experience.
Relevance quality matters more than volume. One precisely relevant suggestion outperforms five generic ones in every test.
Poor Checkout UX
A lengthy, confusing, or surprise-fee-laden checkout process suppresses completion on the high-AOV orders you most want to keep.
In the event of delays, complications, or unexpected costs during the process, customers tend to abandon their baskets, particularly when the cart value is high.
The process should be as straightforward as possible to facilitate the completion of expensive orders.
Wrong Free Shipping Threshold
Set it too low, and you’re giving away shipping on orders that would have happened anyway. Set it too high, and you’re creating a psychological barrier that triggers abandonment on otherwise convertible baskets.
It’s not something you set and forget. As your AOV changes, your threshold should adjust with it.
Measuring AOV Optimisation: Key Metrics to Track
Core Metrics
- AOV trend (7-day, 28-day, quarter-over-quarter) tells you direction and velocity. A single week’s dip is noise; three consecutive weeks are a signal worth investigating.
- Revenue per visitor is the holistic health check — it captures the interaction between AOV and conversion rate, so neither improves at the other’s expense.
- Items per order is the most direct output of bundling and cross-sell programmes. Track this alongside AOV: if items per order rise but AOV doesn’t, recommendations are surfacing low-value items.
Leading Indicators
AOV is a trailing indicator. By the time AOV changes, the actions that led to the change have already occurred.
To do something sooner, you need to track the cues that precede it.
- When customers don’t click on recommended items, it means there is an issue with relevance or placement, not AOV.
- When cross-selling fails, the deal becomes less attractive.
- When bundle pages are viewed but not bought, prices or messaging are wrong.
- When people repeatedly fall short of the free shipping threshold, you know there is potential to tap into.
These are the cues that explain why AOV is what it is.
Margin Tracking
One thing matters more than AOV alone: profitability.
An increase in AOV doesn’t mean much if it’s driven by heavy discounts, stacked promotions, or a shift toward low-margin products.
Always track gross margin per order alongside AOV. Otherwise, you risk optimizing for a number that looks good but isn’t.
How AI and Personalization Are Transforming AOV
The gap between what personalization leaders achieve and what laggards achieve is wide and widening. BCG’s 2025 Personalization Index found leaders running at a CAGR 10 percentage points higher than laggards.
Real-time personalization — adjusting every surface of the experience based on live session behaviour, not just historical data — is where the biggest incremental lifts now live.
Algonomy’s platform connects search (Find™), product and content recommendations (Recommend™), social proof messaging (Social Proof Optimize) and omnichannel marketing (Active Content) to provide end-to-end AI personalization.
Global brands, including Abercrombie & Fitch and Tiffany & Co., use this infrastructure to personalize every touchpoint in real time.
Conclusion: Turning AOV into a Scalable Growth Engine
AOV growth doesn’t require more traffic. It requires doing more with the customers already buying from you.
The retailers achieving 52%+ AOV lifts haven’t found a single tactic. They’ve built a system where every touchpoint works together: AI recommendations surface the right product, personalised search gets shoppers to higher-value items faster, social proof closes the hesitation gap, and content personalisation makes the whole experience feel relevant from first click to checkout.
That’s what Algonomy is built for. Recommend™, Find™, Social Proof Optimize, and Active Content work as one connected layer, so each signal makes the others smarter. The result is AOV growth that compounds rather than plateaus.
Algonomy customers like eXtra have seen 52% higher AOV. See exactly where your revenue is slipping and get a 90-day plan to fix it.

See exactly where your AOV is
leaving money on the table
Frequently Asked Questions
1. What is average order value?
Average order value is the mean amount customers spend per transaction: total revenue divided by the number of orders in a given period. It’s one of the three core ecommerce health metrics alongside conversion rate and revenue per visitor (RPV). Unlike conversion rate, which measures how many people buy, AOV measures how much those buyers spend — making it the primary lever for revenue growth without additional acquisition spend.
2. What is a good average order value?
There’s no single answer,as it depends on your vertical. Fashion averages $100 to $200, luxury $300+, beauty $60 to $90, and B2B can reach $500 to $1,000+. Global general retail sits around $145 (Shopify, 2026). The most useful benchmark is your own category measured against your own trend, not a global average.
3. How do you increase average order value?
The most effective strategies are AI-based product recommendations, product bundling, BNPL services, and proper optimization of the minimum purchase amount required for free shipping. Tiered loyalty programs with spending structures will always be effective ways to increase average revenue per user.
4. Does free shipping increase AOV?
Yes, when the threshold is set correctly. 58% of consumers actively add items to their cart to qualify for free shipping, and well-calibrated thresholds drive AOV improvements of 15–30%. The threshold should sit 15–25% above your current AOV. Too low and you’re giving away shipping on orders that would have happened anyway; too high and you push customers into abandonment.
5. Is AOV more important than conversion rate?
Neither is more important — they move together. Revenue per visitor (RPV = AOV × conversion rate) is the number that tells you whether you’re making net progress. An AOV improvement that comes at the cost of a steeper conversion drop is not an improvement. The goal is to raise both, or at minimum raise one without significantly hurting the other.
6. What tools help increase AOV?
Algonomy Recommend™, Find™, Social Proof Optimize, and Active Content are among the most powerful AI personalization platforms for increasing AOV. BNPL solutions like Klarna and Affirm allow customers to make bigger-ticket purchases. With GA4 and a CDP solution, you’ll know which segments are performing well at a glance.
7. What is AOV vs RPV?
Average Order Value (AOV) is simply revenue divided by the number of orders. Revenue Per Visitor (RPV), on the other hand, is calculated by dividing revenue by the number of visitors, regardless of whether those visitors made a purchase. RPV is a more robust metric because it combines purchase frequency and the number of purchases into a single metric. An increase in AOV of 15% paired with lower conversion rates from lower-quality traffic could lead to a reduction in RPV.